 Listen Online
 Watch Online
 Find a Station in Your Area


By: Dan McLaughlin – nationalreview.com – October 16, 2018
A detailed look at the numbers.
How will the Senate races break? We have less public polling to go on than in recent years, so answering that question is harder than ever. But the news is more optimistic for Republicans than it was a month ago.
Waves and Breakers
Four years ago, I projected in mid September that if “historical patterns hold in 2014, we would . . . expect Republicans to win all the races in which they currently lead plus two to four races in which they are currently behind, netting a gain of 8 to 10 Senate seats.” This was far from the consensus at the time, but in the end, Republicans picked up nine seats.
As I noted at the time, drawing on Sean Trende’s work on the relationship between presidential approval ratings and Senate races, the most important factor in Senate races is the state’s political climate, which typically is tied to the national political climate. That’s not the only factor, of course; others, such as incumbency and candidate quality, also matter. But going back over the past two decades, most Senate elections have been held in at least mild “wave” conditions: The president’s approval rating and the generic congressional ballot both pointed in the same direction. And the results showed a strong pattern: Looking at the RealClearPolitics poll averages, candidates with the wave at their back and a polling lead or tie in a close race in mid September won nine out of twelve races between 2002 and 2012, whereas candidates running against the wave with a lead or tie in a close race in mid September lost 21 out of 34 Senate races. And of the ten races where the wave party overcame at least a 2.5-point poll deficit, six were against incumbents, showing that the wave environment was stronger than the entrenched value of incumbency.
That trend was even stronger in 2014. My method, tracking the 2014 Senate and governor’s races, was to follow the “breakers” — the undecided voters who gradually made up their minds or decided to stay home. Two Republicans saw the bottom drop out of weak campaigns (in Michigan and Oregon) and one Democrat actually lost support down the stretch (Mark Warner in the thinly polled Virginia race), but in all the others, you could approximate a measure of how late deciders contributed the final outcome by looking at what percentage of the remaining undecideds ended up on each side — and of the 15 races where both candidates were below 50 percent in mid September, Republicans won ten of the 15, and their final vote was consistent with getting at least 60 percent of the undecided vote in eight of their ten wins plus New Hampshire and Virginia.
But then, in 2016, something funny happened: Starting in March, Barack Obama’s job approval was in the black for the first time since 2012, and by mid September he was over 50 percent approval, around +4. The Democrats led in the generic ballot, too: by +2 in mid September and as much as +6 in mid October. Based on the RCP poll averages, the mid-September polls projected a D+3 outcome (Democrats gain seats in Illinois, Wisconsin, Pennsylvania, and Indiana, and lose a seat in Nevada). But in the end, the outcome got worse for Democrats: They ended up at D+2, gaining just one of the four races they led in mid September (Illinois, which had not been close) plus New Hampshire and reclaiming their lead in Nevada. But the Wisconsin, Pennsylvania, and Indiana races got away from them, and so did the seesaw race in North Carolina.
Did the 2016 Senate results buck a Democratic wave? Not really. True, Democrats won the national popular vote for president and picked up a net gain of six seats in the House. But their supporters were too geographically concentrated, with Hillary Clinton winning a popular majority in just 13 states and Republicans’ 241–194 House majority outstripping their more modest 49.1 percent–to–48 percent victory in the House vote. In the end, even though Republican Senate candidates ran ahead of the presidential ticket and often drew on different supporters than Donald Trump did, the Senate outcomes paralleled the presidential race: Every one of the 34 Senate races was won by the party that carried that state in the presidential race, the first time this has happened since senators first became popularly elected in 1913.
State of the Senate
That leaves us with our first dilemma in projecting 2018: Nationally, this should be a Democratic wave year, at least a modest one. President Trump’s job-approval rating on RCP has been underwater since a few weeks after he took office; it was 12.5 points in the red on September 15 (40.9 approval, 53.4 disapproval), and at this writing stands a little under ten points down, with his approval rating having stabilized again around 43 percent, roughly where he has been for most of the time since early May. The generic ballot has likewise shown a Democratic lead all year; it stood at D+8.3 on September 15, and at this writing is D+7.3. That is, both measures have tightened a bit in the GOP’s favor in the past month, but not dramatically enough to suggest anything but a blue wave of at least some size.
But as in 2016, the Senate is not a national election but a series of state-by-state elections with very different electorates. And this year has an unusually red map — by some measures, it’s the most hostile map any party has ever faced in a Senate election. Only nine Republican-held seats are up for grabs (with the incumbents seeking to hold six of them), and just one of the nine (Dean Heller in Nevada) is in a state Democrats have carried in a national election more recently than 1996. By contrast, the Democrats are defending 26 seats, including five in states where Donald Trump won 55 percent to 68 percent of the vote (West Virginia, North Dakota, Indiana, Missouri, and Montana), five others in states Trump carried narrowly in 2016 (Florida, Ohio, Wisconsin, Pennsylvania, and Michigan), four in states that have recently been competitive (Virginia, Maine, and two in Minnesota), plus one occupied by an incumbent who narrowly escaped going to federal prison a year ago (New Jersey). On the upside, Democrats are running incumbents in all 26 races.
Each side has recruited one truly top-shelf challenger: Republican two-term incumbent governor Rick Scott in Florida, and Democratic former two-term governor Phil Bredesen in Tennessee. Republicans are also running the most popular candidate imaginable for the open seat in Utah, Mitt Romney, who won 72.6 percent of the vote there in the 2012 election (only Ronald Reagan in 1980 and 1984 topped that since 1900). There is also one race with a significant enough third-party candidate to scramble the picture: former two-term Republican governor and two-time Libertarian presidential candidate Gary Johnson is running as a Libertarian in New Mexico.
So the first question we should ask is what the environment in those states looks like right now. State-by-state polling for presidential approval tends to be spotty, and for the generic ballot just about non-existent, but as at least a rough proxy we can look at Morning Consult’s monthly tracking poll, which as of September showed Trump’s presidency in very different light depending on the state:
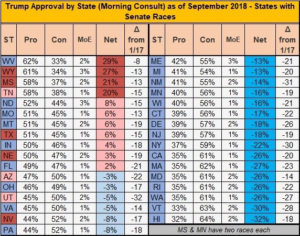
Among the seats Republicans are defending, four are in states where Trump is still wildly popular (including two contested races, Tennessee and the Mississippi special election); two are in states (Texas and Nebraska) where he’s still got at least 50 percent support; and one is in a state (Utah) where Trump is unpopular but the state is too Republican, and Romney too popular, for that to matter. That leaves just two states where Trump’s approval looks anything like the national average, Arizona and Nevada, and even in Arizona, Trump at −3 (47–50) is not that big a drag.
By contrast, the five states that were deep red for Trump in 2016 now range from red to very red, and Trump is above water in Florida and not that far down in Ohio and, surprisingly, Virginia. But on the whole, his support in the Midwest has taken a dive out of proportion to the rest of the country: he’s at −8 in Pennsylvania, −13 in Michigan, −16 in Wisconsin and Minnesota.
So, when we do our first cut of the Senate races that you’d want to watch, as of the polls through October 15, you get this:
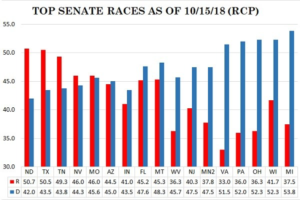
I say “that have been polled” because RCP, at least, does not view any of the polls in the Mississippi Senate special election as credible enough to count; we’ll come back to Mississippi later.
Bear in mind that, assuming no upset in Mississippi, Republicans need to win three of these eleven races to keep the Senate at least 50/50 (in which case Mike Pence would break ties to retain control of the chamber), four to keep their current 51-seat majority, and five to actually expand their majority. At first glance, this divides the key races into three groups. Three races — those in North Dakota, Texas, and Tennessee — look pretty solidly Republican. Four races — in New Jersey, West Virginia, Montana, and Florida — look pretty good for the Democrats. Four others are still practically toss-ups (in Nevada, Missouri, Arizona, and Indiana), with only Dean Heller in Nevada having clawed his way as far as 46 percent of the vote.
But the percentages can be misleading in a couple of ways. Let’s break down the polling we have, with Trump’s approval rating in each state for perspective on the state environment. In the seven races with no polling at all, I just plugged in the president’s approval rating as a proxy, but that undoubtedly understates how safe incumbents such as Deb Fischer and Maria Cantwell are:
To see the remainder of this article, click read more.![]()
Source: Midterm Senate Races: Polling Optimistic for Republicans


 Listen Now
 Watch Online
