Kerby Anderson
With estimates that the federal deficit will increase this year, we are once again hearing comments about making the “rich pay their fair share.” Even if we set aside the moral arguments, there is still the reality that attempts to “soak the rich” haven’t generated the tax revenues promised by progressive politicians.
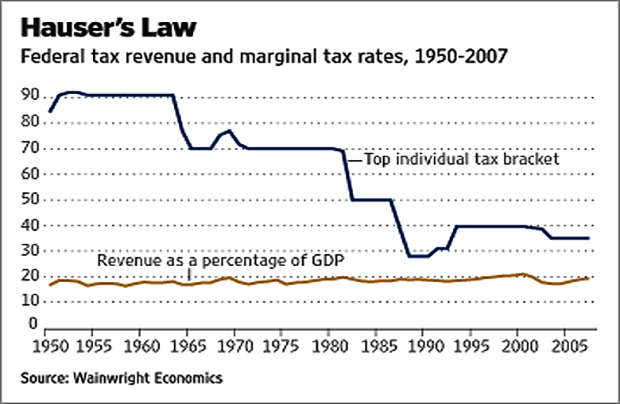
To illustrate this, look at one of the most boring graphs in economics. If you plot federal government revenue as a percentage of GDP, you get an approximately horizontal line. This has come to be known as “Hauser’s Law.” Thirty years ago, investment analyst Kurt Hauser wrote that no matter what the tax rates, the tax revenues remained at approximately the same percentage.
If you plot the top individual tax rate, you will see how tax rates and tax revenues are not connected. In the 1950s, the top marginal tax rate was 90 percent. President Reagan slashed the tax rate to 50 percent. Today’s top rate is 37 percent. Throughout these fluctuations, the percentage of tax revenue as a percentage of GDP was around 17-19 percent. Here is a link to a Wall Street Journal commentary from 15 years ago that includes the graph. The author argues that Hauser’s Law should become as central to economics as Boyle’s Law is to the physics of gases.
Unfortunately, most politicians are unaware of it. Progressive politicians are convinced that if you increase tax rates you will increase tax revenue. I won’t bore you with other graphs, but generally the inverse is true. Raising the rates for income tax, capital gains tax, and inheritance tax usually generates less revenue.
The current debate about taxes and spending could use some wise economic insights found in a horizontal line on a graph.
 Listen Online
 Watch Online
 Find a Station in Your Area


 Listen Now
 Watch Online
