Kerby Anderson
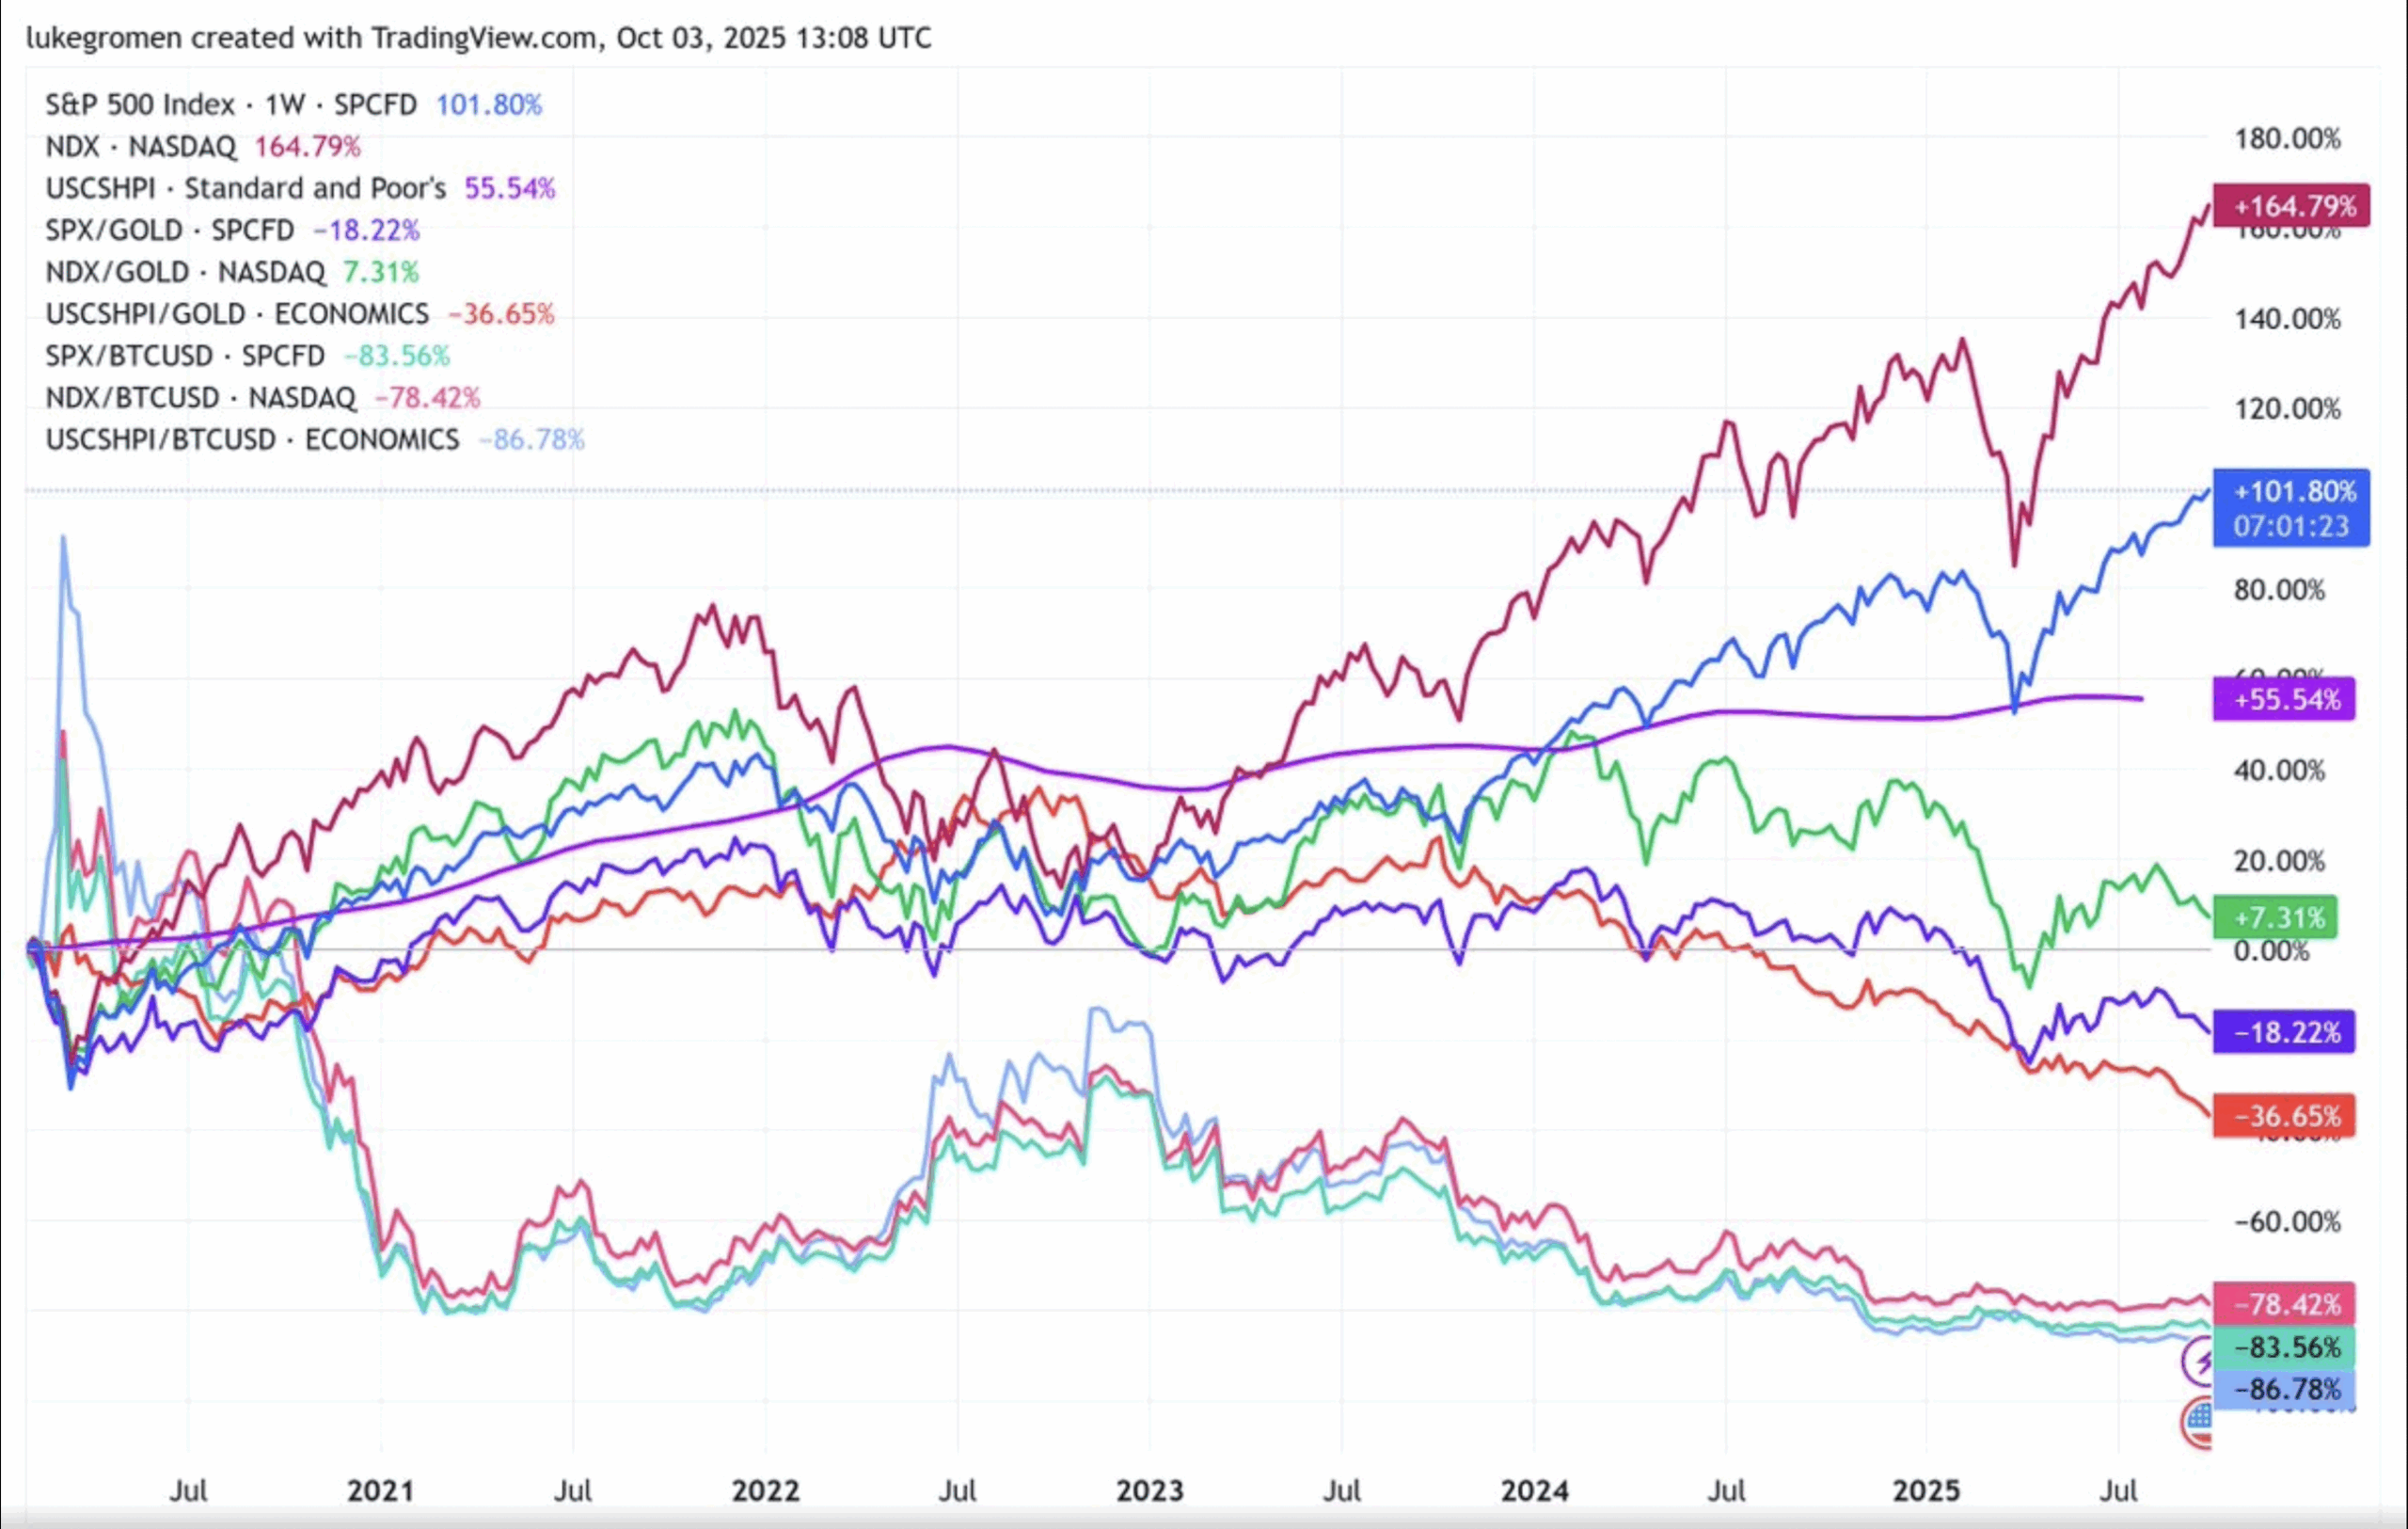
Luke Gromen has published a series of graphs that illustrate “the debasement trade” since COVID. First, let me try to define the concept of a debasement trade. It is the recognition that debt in the U.S. and many other developed countries is at “such historically high levels that some investors no longer see bonds as a safe haven.” That is why investors are putting their funds in gold and bitcoin.
The graphs by Luke Gromen illustrate that while the numbers are going up when priced in U.S. dollars, they are going down if they are priced in other commodities. For example, when priced in dollars, Nasdaq is up 165 percent, the S&P is up 102 percent, and home prices are up 56 percent.
However, when priced in gold, Nasdaq is up just 7 percent, the S&P is down 18 percent, and house prices are down 37 percent. You see more extreme percentages when priced in bitcoin: Nasdaq is down 78 percent, the S&P is down 84 percent, and home prices are down 87 percent. You might check out the graph linked to this commentary to see these results.
These percentages illustrate the difference between Wall Street and Main Street, or the difference between the wealthy and the middle class. The stock market is going up, but only if you measure it in dollars, which have been declining in value.
If you have stock or own appreciating assets, you feel good about the direction of this country. If you are trying to pay for groceries, gas, and rent, you don’t feel like the country is doing well. Inflation and the declining value of the dollar are hurting most Americans.
Even wealthy individuals are moving their funds to assets that have a better chance of keeping value because the dollar is losing value each year.
 Listen Online
 Watch Online
 Find a Station in Your Area


 Listen Now
 Watch Online
