Kerby Anderson
When it comes to government economic numbers, you don’t know who to believe. A good example came from a recent TV interview with Janet Yellen. In case you aren’t familiar with her, she has been the Secretary of the Treasury since January 2021. Before that she was the chair of the Federal Reserve for four years.
She was asked if America could afford a second war when the US debt-to-GDP was at 122%. Of course, she said America can afford to stand with Israel and Ukraine. Then she added, “I don’t know where the 122% number comes from, the US Federal Debt to GDP ratio is about 98% right now.”
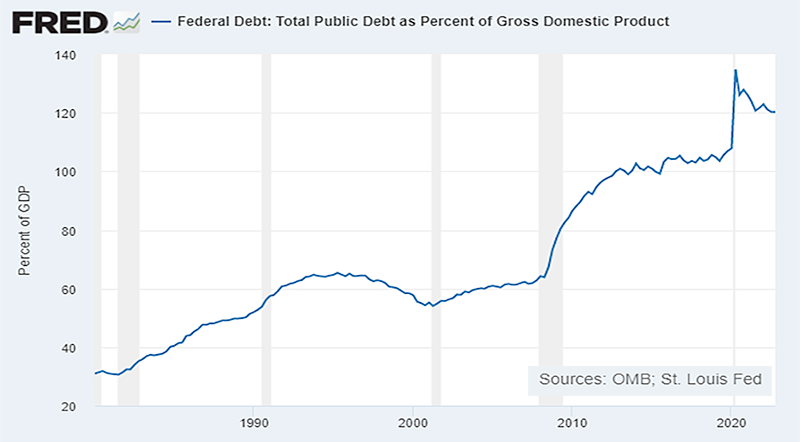
That statement is troubling since that 122% comes from the Federal Reserve chart posted by the St. Louis Fed. I could post the chart. But let me suggest that you do the math yourself.
The national debt clock lists the national debt at $33.6 trillion. You can then go to any website and find that the estimated GDP for this year is $26.9 trillion. Divide 26.9 into 33.6 and you come up with 124.9%. She says she doesn’t know where the 122% number comes from. It comes from dividing GDP into the national debt. It comes from looking at the graph of the Federal Reserve, where she worked for four years.
Then where does she get the 98% number? That comes from the Congressional Budget Office and strikes many of us as just another manipulated economic estimate. Because if you look at the Federal Reserve chart, you will see the debt-to-GDP hasn’t been 98% in a decade.
The percentage is important. In previous commentaries, I have documented that nearly all (98%) nations that have surpassed a 130 percent debt-to-GDP ratio eventually defaulted. We are much closer to that dangerous territory than Janet Yellen will admit.
 Listen Online
 Watch Online
 Find a Station in Your Area


 Listen Now
 Watch Online
